
 About
About What is your investment horizon and how do you determine it?
16 June 2026

Anyone who invests wants to know whether it is a favorable time to buy or sell. Technical analysis is one of the methods that investors use to help make these decisions. Instead of looking at the underlying value of an investment, technical analysis studies the price chart itself: price movements, patterns, and trading volume.
In this knowledge center article, you will read about what technical analysis is, the core principles it relies on, which indicators are used most frequently, how to perform an analysis yourself, and how to apply this method to the prices of gold and silver.
Technical analysis is the process of analyzing price charts to estimate potential future price movements based on historical price data and trading volume. The method assumes that all known information is already reflected in the market price, that prices move in trends, and that history repeats itself through chart patterns.
Technical analysis is primarily a tool to help determine the timing of entry and exit points, rather than a guarantee of returns.
Technical analysis is a methodology where you study price charts to assess future price directions. You use historical data, such as market price and trading volume, to search for recognizable patterns and trends. Based on these findings, you attempt to determine a favorable moment to buy or sell.
This method is also frequently referred to as price analysis or chart reading. The foundational idea is that investor behavior, and consequently the price action, exhibits a certain degree of repetition.
Technical analysis is widely utilized for short-term to medium-term decision-making and stands in contrast to fundamental analysis, which evaluates the underlying intrinsic value of an asset.
Many private investors make decisions based on daily news or emotions. A sharply rising price triggers greed, while a temporary decline causes fear. This is precisely where technical analysis can offer structure. By looking at objective price levels beforehand, you trade less on emotion and more on what the market is actually doing.
For instance, you can see whether a price increase is supported by high volume, whether a decline fits within a normal market correction, or whether a price is approaching a critical level.
For gold and silver, this is particularly valuable because these markets are sensitive to sentiment and can fluctuate significantly in the short term. Technical analysis removes a layer of emotion from your decision-making, though it never guarantees the final outcome.
Technical and fundamental analysis are often presented as opposing views, but in practice, they complement each other well. One looks at the price chart, while the other looks at the underlying value. Investors who understand both can evaluate a market more completely.
The table below outlines the key differences side by side.
| Aspect | Technical analysis | Fundamental analysis |
|---|---|---|
| Focus | Price chart and volume | Underlying value and market conditions |
| Question | When to buy or sell | What is it worth and why |
| Time horizon | Primarily short to medium term | Primarily long term |
| Data types | Historical price data | Supply and demand figures, macroeconomics |
A simple way to remember it: fundamental analysis helps answer what you want to own, while technical analysis helps answer when to buy, sell, or re-evaluate. For stocks, fundamental analysis looks at earnings and revenue.
With precious metals, it works differently: gold and silver do not yield corporate profits or dividends, so fundamental analysis there focuses on global supply and demand, interest rates, the US dollar exchange rate, inflation, and central bank purchases.
How these factors play out can be read in our article on the influence of the ECB interest rates on precious metals.
Technical analysis has historically relied on three major assumptions, which trace back to the foundational work of Charles Dow.
First, the market discounts everything. The idea is that all known facts, future expectations, and emotions are already factored into the live price. Therefore, the price is the starting point of the analysis, rather than the news driving it.
Second, prices move in trends. A price rarely travels in a straight line up or down, but instead displays a recognizable direction: an upward trend, a downward trend, or a sideways trend (a trading range).
Third, history repeats itself. Because market behavior is largely driven by human psychology, certain geometric patterns return on the charts with regular frequency. This is exactly what a technical analyst tries to identify.
Before you start adding indicators, it is vital to master the basics of a price chart. Three elements form the foundation of almost any technical analysis: the chart where you read the price action, the trend that dictates the direction, and the support and resistance levels where price frequently reacts. We explain them below.
Charts and candlesticks. The candlestick chart is the most widely used tool. Each candle displays four data points within a specific timeframe: the opening and closing prices (which together form the "body") and the highest and lowest prices (the "shadows"). A green candle means the closing price was higher than the opening price; a red candle means it was lower.
Trends and trend lines. By connecting consecutive peaks or troughs, you draw trend lines that visually reveal the trajectory of the market. Always determine the dominant trend before expanding your analysis.
Support and resistance. A support level is a price below which the asset seems to have difficulty falling because buyers tend to step in at that area. A resistance level is a price above which the asset seems to have difficulty rising because sellers become active. If a price breaks clean through such a level, many analysts view it as a potential signal of a trend change. It provides no certainty; confirmation from other signals remains necessary.
In the chart below, you can see the four building blocks of technical analysis brought together on an illustrative gold price chart. The gold price (gold) moves in an upward trend, where the rising troughs together form the upward trend line. The price repeatedly hits a resistance zone (red) and bounces upward from the support zone (green).
The 200-day moving average (blue) runs below the price action and confirms the upward direction. When the price eventually breaks through the resistance, analysts refer to this as a breakout, a widely followed signal that the trend may continue.
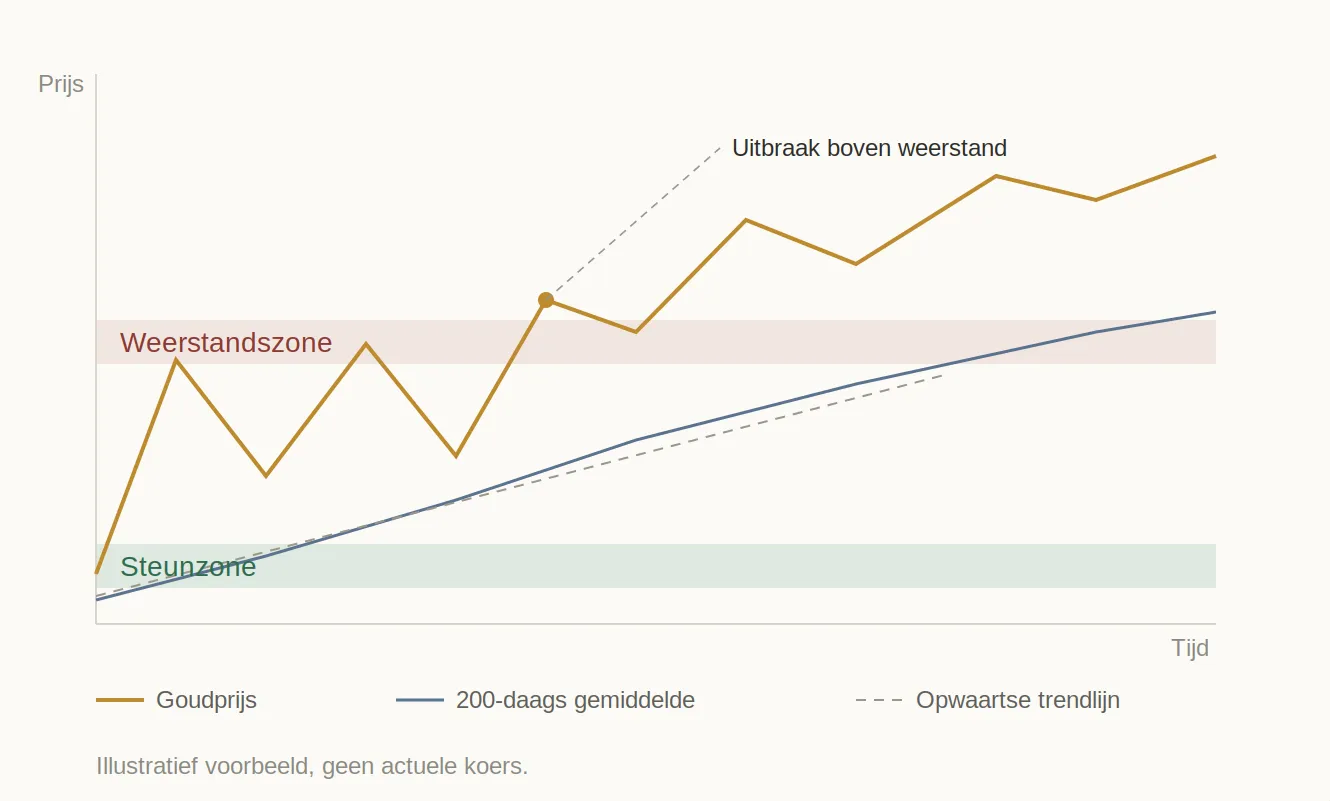
Illustrative example of technical analysis on the gold price: an upward trend with support and resistance zones, the 200-day moving average, and a breakout above resistance. This does not represent actual market data.
In addition to trends and indicators, technical analysts watch for recurring shapes on the chart: chart patterns. These patterns occur because the behavior of buyers and sellers repeats with a certain regularity.
They are broadly divided into reversal patterns, which indicate a potential turn in the trend, and continuation patterns, which signal a likely continuation after a temporary breather.
The most famous reversal patterns are:
Among continuation patterns, triangles are the most well-known. During an ascending, descending, or symmetrical triangle, the price moves within an increasingly narrow range, as if the market is taking a breather. If the price breaks out afterward, it often happens in the direction of the existing trend.
It is important to note that a pattern never offers certainty. Patterns fail regularly, and a breakout can also be a false signal. They are most reliable when you combine them with trading volume and other signals, such as a breakthrough of a support or resistance level. With silver, which is naturally more volatile than gold, chart patterns also generate false alarms more frequently than with the more steadily progressing gold.
Indicators are calculations based on price data that provide additional market context. They are generally separated into trend-following (lagging) indicators, which confirm an existing trend, and momentum (leading) indicators, which attempt to signal an upcoming change. The most commonly used are:
No single indicator is "the best", and the exact same indicator can yield different results across varying markets. They are most reliable when you combine a few that complement and confirm one another.
Keep an eye out for divergence: if the price and an indicator move in opposite directions, it can signal an impending market reversal.
Performing a technical analysis follows a logical sequence of steps. This helps you establish structure and make decisions less reliant on emotion:
While technical analysis is frequently illustrated using corporate stocks, it is just as applicable to precious metals. You analyze the gold and silver charts in the exact same manner for trends, support, and resistance.
However, there are clear differences between the two metals. Gold is widely viewed as a more defensive asset and fulfills a role as a safe haven. Silver, alongside its investment function, has a heavy industrial application side, making it inherently more volatile. A positive technical signal for gold does not automatically translate into the same outcome for silver: silver can rise faster, but it can also correct harder, leading to more frequent false alarms on the silver chart.
For those considering buying physical gold or buying silver, technical analysis serves primarily as a tool to optimize an entry point, rather than a prompt to trade rapidly. Many physical metal investors operate on a long time horizon and choose to spread their purchases over multiple intervals, making them less dependent on a single price point.
Technical analysis can also provide support when determining a selling point; we delve deeper into this in our article on when it is best to sell gold and silver.

For buying gold and silver, the technical analysis is mainly a tool to pick the best entrypoint and it's not used for quick trades.
Within wealth management, technical analysis is not about rapid trading, but about better decision-making. A logical sequence helps in this regard. First, determine what portion of your wealth you want to hold in physical precious metals; that is a strategic choice, not a chart question.
Next, look at whether the gold and silver prices are in an upward, downward, or sideways trend, and locate the key support and resistance zones. Only after that do you determine whether to buy immediately, enter in phases, or wait for more confirmation.
This ensures technical analysis remains subordinate to your plan, rather than the other way around. We further elaborate on the distribution of your wealth in asset allocation and the role of precious metals in the portfolio, as well as the trade-off between the short and long term in structural wealth accumulation: long term versus short term.
To get the most out of your chart analysis, it is advisable to avoid the following common pitfalls:
Technical analysis is an additive tool, not a crystal ball. To begin with, it is not an exact science: interpreting charts is partially subjective, and two separate analysts can look at the identical chart and read it differently.
Furthermore, there is foundational academic criticism against it. According to the Efficient Market Hypothesis, all known information is already perfectly priced into the asset, meaning that studying historical chart data has zero predictive value according to critics. Whether you share that criticism or not, it highlights that technical analysis is controversial and must be used with nuance.
The methodology works best as part of a broader framework, paired with fundamental analysis and a well-planned asset diversification strategy. Investing involves risks, and past performance is no guarantee of future results.
Technical analysis helps you read price charts more clearly by highlighting trends, support and resistance zones, moving averages, and momentum metrics. For gold and silver investors, it serves as a valuable practical tool to help determine entry and exit points while removing raw emotion from your decision-making process.
Yet, it remains far from a crystal ball: the method performs best when aligned with fundamental analysis, a clear investment horizon, and thoughtful portfolio diversification. Therefore, use it with realistic expectations as part of your wider wealth strategy.
This article is intended purely for informational purposes and does not constitute personal investment advice. Investing involves risks; you can lose a portion or all of your investment. Past performance is no guarantee of future results.
Technical analysis is the study of price charts to assess potential future price movements based on historical price data and trading volume. Instead of measuring an asset's underlying intrinsic value, you look for trends and geometric patterns on the chart to determine a favorable time to buy or sell.
You begin by selecting a specific price chart, such as gold or silver. Next, you choose an appropriate time horizon, identify the dominant trend, draw in support and resistance zones, and layer on one or two indicators, such as a moving average and the RSI. You use the final reading as a guide to probability, not as a mathematical certainty.
The most widely used indicators are the moving average, the RSI (relative strength index), the MACD, Bollinger Bands, and trading volume. The moving average reveals the trend, the RSI measures whether an asset is overbought or oversold, and the MACD signals changes in market momentum. They perform best when utilized together.
Yes, you can apply technical analysis to the gold and silver prices in the exact same manner as corporate stocks. Keep in mind that precious metals do not pay out interest or dividends and are heavily driven by macroeconomic forces. Furthermore, silver is more volatile than gold, meaning its chart signals can result in false alarms more often.
No, not perfectly. Technical analysis is not an exact science and provides no guarantees: it outlines probabilities rather than certainties, and chart interpretation remains partially subjective. The methodology is most reliable when you combine multiple indicators and use it to complement fundamental analysis and proper portfolio diversification.
Technical analysis looks at price movements, trends, and patterns on a chart to determine when to trade. Fundamental analysis looks at the underlying value and macroeconomic conditions to determine if an asset is worth buying. For gold and silver, fundamental analysis revolves around inflation, interest rates, the US dollar, geopolitics, and global supply and demand.
That depends entirely on your investment objective. For long-term investors, weekly and monthly charts are generally more important than daily charts because they display the primary trend more cleanly. Those looking to execute phased purchases can additionally look at a shorter timeframe to evaluate an immediate entry point. Always align your chart timeframe with your personal investment horizon.
Rolf van Zanten is the founder and owner of The Silver Mountain, a specialist in physical precious metals since 2008. With nearly twenty years of experience in the precious metals trade, Rolf shares his expertise on investing in gold, silver, and platinum in an accessible and reliable way. His knowledge of the international gold and silver markets helps investors make well-informed decisions. In his role as an expert, he strives to ensure that transparency, security, and trust are at the heart of every purchase.
Be the first to discover the latest products and the latest news about precious metals.

