The gold price is constantly fluctuating due to global market movements. On this page, we provide the most accurate gold rate per gram, kilogram, and troy ounce. By combining our live data with historical gold price charts, you gain immediate insight into the latest trends within the precious metals market.
Current rate: € 118.225,44
The gold price today is updated every few minutes to reflect international trading. This ensures you always have access to the actual gold value when you are looking to buy or sell.
Current gold price in the Netherlands: gram, kilo, and troy ounce
While the international standard for the price of gold is displayed per troy ounce, most investors in the Netherlands prefer rates per gram or kilo.
On this page, you can track the live gold price across all major denominations. It is important to note that the price per gram is typically lower when purchasing larger volumes, such as a 1-kilogram gold bar, as the relative production costs decrease.
Gold price chart: from 1 day to 50 years
To understand the true value of gold, it is essential to analyze historical performance. Our interactive gold price chart allows you to view price developments over the last 50 years.
Gold prices over the last 10 years
Over the past decade, the gold value has more than doubled. In 2016, the price hovered around €31,000 per kilo. Since then, we have seen a steady upward trajectory, fueled by low interest rates and a growing demand for financial security in uncertain times.
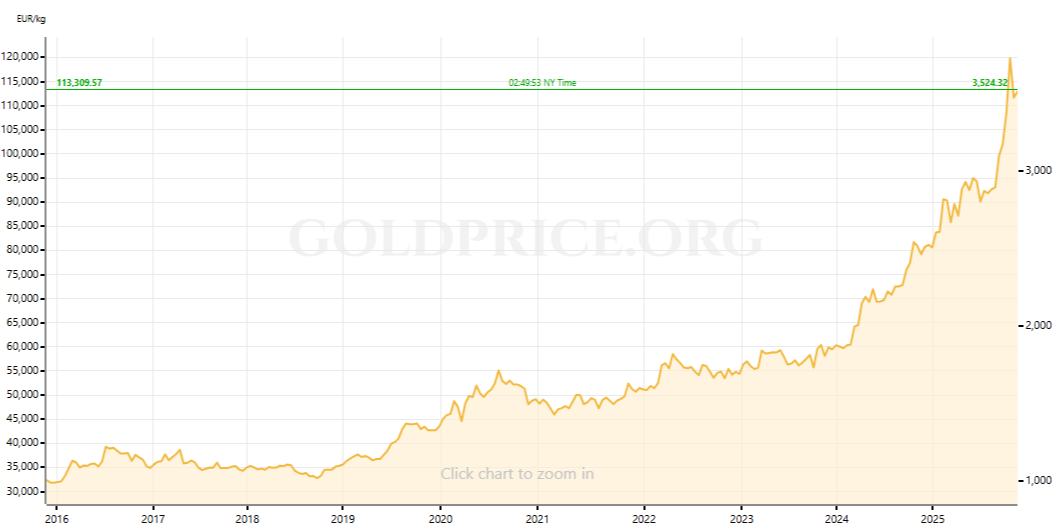
source: goldprice.org
The gold price development over the last 10 years shows a structural upward trend, with significant peaks during periods of geopolitical and economic instability.
Gold rate over the past 20 years
When looking at the historical gold price of the past 20 years, the enormous impact of the 2008 financial crisis is undeniable. During this period, the gold price doubled in a short amount of time, emphasizing the role of gold as the ultimate insurance within an investment portfolio. In 2006, the gold price was around €13,500 per kilo.
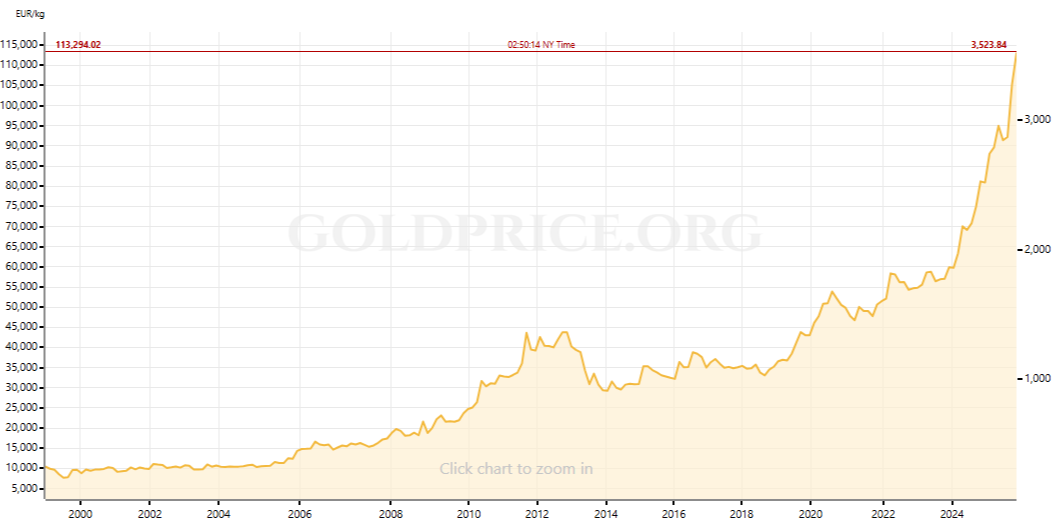
source: goldprice.org
This period clearly illustrates how the gold price reacts to financial crises and changes in monetary policy.
Gold rate over the past 50 years
The gold price chart of the past 50 years shows the most powerful increase. From approximately $3,500 per kilo in the 1970s to the current record highs. This historical data demonstrates that over the very long term, gold is one of the most stable forms of wealth preservation.
Future outlook: what will the gold price do?
Many investors wonder if the current record prices are sustainable. When determining your entry point, it is valuable to consider the long-term gold price forecast and your personal investment horizon. Would you like more insight into potential developments? View our analysis of the gold price forecast and various long-term scenarios.
How the gold price is determined
The gold rate is determined by global trading on major exchanges like the LBMA (London) and COMEX (New York). The prices shown here are based on the live spot price, which fluctuates 24/7 based on supply, demand, and currency movements.
These are the most frequently asked questions about the gold rate
Frequently asked questions about the gold price
How can I calculate the gold price per kilo and per troy ounce?
To convert the value of your gold to troy ounces or kilograms, you can use the following formulas:
- Price per kilo: price per gram × 1,000 = price per kilo
- From gram to troy ounce: number of grams × 0.032151 = price per troy ounce
- From troy ounce to gram: number of troy ounces ÷ 0.032151 = grams
Please note that when purchasing physical gold, the price per gram is often lower when buying larger units, as the production costs are distributed over a greater weight.
Why is the price per gram different from the price per kilo or troy ounce?
Gold is traded internationally per troy ounce. The kilo price is the standard for bars. Because the production costs for larger bars are spread over more weight, a kilo of gold is often relatively cheaper per gram than smaller units.
What does the historical gold price say about future trends?
Historical data shows how gold behaves under various economic conditions but does not guarantee future results. However, it is observable that gold historically finds support during periods of high inflation, rising debt, or falling real interest rates. The chart shows how such trends have correlated with price movements in the past.
How do I stay informed about changes in the price of gold?
You can easily set a price alert on this page. You will then receive a direct, no-obligation notification as soon as gold reaches your desired price level, allowing you to act immediately.
Can I sell gold immediately when the rate is high?
You can sell your gold back to us at any time. Thanks to our fixed buy-back guarantee of 98% of the current gold value, you can act quickly when you want to realize profits or need liquidity.
What is the impact of real interest rates on the gold price?
Real interest rates have a direct influence on the price of gold. When real interest rates are low or negative, gold becomes more attractive as other investments offer lower returns. If real interest rates rise, the demand for gold often decreases, as investors can earn a higher yield elsewhere.
What is the current gold price today?
You can see the current gold price today at the top of this page in the live chart. The rate is continuously updated based on international trade, allowing you to always follow the most recent gold price per gram, kilo, and troy ounce.
Disclaimer: This article is not intended to be professional investment advice or a recommendation to make certain investments.

